


Prevalence of Prejudice-Denoting Words in News Media Discourse
Summary of manuscript “Prevalence of Prejudice-Denoting Words in News Media Discourse: A Chronological Analysis”

Published article: Prevalence of Prejudice-Denoting Words in News Media Discourse: A Chronological Analysis
Overview
I recently published an article with Musa Al-Gharbi and Jamin Halberstadt where we analyzed the prevalence of words denoting prejudice in 27 million news and opinion articles written between 1970 and 2019 and published in 47 of the most popular news media outlets in the United States such as The New York Times, The Washington Post, The Wall Street Journal or Fox News, see AllSides Media Bias Chart v1.1 [1] in Figure 1.
Our analysis focused primarily on tracking the prevalence of words that describe prejudice such as racism, sexism, islamophobia, anti-Semitism and homophobia. We then examined the relationship between the usage of prejudice-denoting terms in written news media and other factors, such as news outlets’ ideological leanings or the prevalence of prejudice-signifying words in cable news. We also attempted to elucidate whether the prevalence of prejudice denoting words in news media discourse changed before or after 2015, a significant year that marked the beginning of the 2016 U.S. Presidential election campaign. Our analysis continued by investigating whether some outlets preceded others on the usage dynamics of prejudice denoting words. Finally, we examined the relationship between the prevalence of prejudice denoting words in news media discourse and public opinion perceptions about prejudice severity in the wider society.

Frequency of word usage in news media articles
Yearly frequency of a target word in an outlet in any given year was estimated by dividing the total number of occurrences of the target word in all articles of a given year by the total number of all words in all articles of that year. This method of estimating frequency accounts for variable volume of total article output over time. Figure 2 shows the min-max scaled yearly frequencies of several sample words in The New York Times content during the past 50 years to illustrate that our method produces sensible results.

Comparing the frequency of words across different outlets can be informative to illustrate the different saliency of themes across outlets. Figure 3 shows similar and distinct patterns of word occurrence across 4 different news outlets that target different news consumption market segments.

Prevalence of prejudice-denoting words in written news media
Figure 4 illustrates the increasing prevalence of words denoting different types of prejudice in two prestigious newspapers in the United States: The New York Times (in blue) and The Washington Post (in red). A clear trend of increasing prevalence of prejudice related terms is apparent with words such as racist or sexist increasing in usage between 2010 and 2019 by 638% and 403% in The New York Times or 514% and 141% respectively in The Washington Post. The yearly usage of prejudice related words is highly correlated between both outlets as shown by the Pearson correlation coefficient, r, in the upper left corner of each plot.

Aggregating yearly frequency counts across the 47 news media outlets analyzed shows that the trend from Figure 4 is not circumscribed to The New York Times and The Washington Post but it is the general tendency across most news media outlets, see Figure 5. The pattern highlighted in Figure 5 is not exclusive to the specific set of words shown in the figure. A different set of prejudice related terms also shows a similar trend, see details in original manuscript. A very subtle trend in Figure 5 (highlighted by the grey dashed vertical bar) is that the prevalence of a reduced set of prejudice-denoting words such as racism, sexism or bigotry, also experienced a milder usage peak in the 1990s.

We next used factor analysis to quantify shared variability among the studied prejudice denoting terms. Factor analysis allows elucidation of whether an underlying latent factor captures most of the variance observable in the individual dynamics of each prejudice-denoting term time series. Factor analysis of all the prejudice-signifying words in Figure 5 and 20 additional prejudice-denoting terms does indeed show that a single factor accounts for over 76% of all the variance.

Figure 7 plots the prevalence of prejudice related words in news outlets aggregated by ideological leanings using human annotations of media political bias from the 2019 AllSides Media Bias ratings v1.1 [1]. The Figure shows that the growing usage of prejudice related words in news articles has been consistent across news outlets regardless of their ideological leanings, but overall, prejudice-denoting words appear to be less prevalent in centrist outlets as shown by the green trend lines (representing centrist outlets) being consistently below the blue (left-leaning outlets) and red (right-leaning outlets) trend lines.

We next compared overall news media prevalence across prejudice types. Figure 8a shows the average prevalence of related word pairs denoting six distinct types of prejudice. Both historically and in recent years, the racism theme displays the highest absolute prevalence in news written articles followed by anti-Semitism, sexism and homophobia.
Figure 8b shows the min-max scaled average frequencies of prejudice-specific word pairs to highlight times of maximum relative usage irrespective of overall prevalence. Notice that for the year 2019, four different types of prejudice cluster in the top right of the plot, denoting maximum usage over the entire time range. A dashed grey vertical bar indicates the year 2015, when Donald Trump entered the contest for the nomination of the Republican Party to the presidency of the United States. The figure shows that in the previous year, 2014, the usage of words denoting racism, homophobia, transphobia or sexism were at or near, up to that year, all-time highs. These results suggest that the trend of increasing prevalence of prejudice related words in media discourse precedes the political emergence of Donald Trump -- although Trump’s presidency and subsequent reactions to it may have exacerbated these trends.
To discern whether the increasing usage trend of prejudice denoting words accelerates after 2015, we carried out a paired t-test of the word pairs frequencies slopes between 2010-2014, and 2015-2019 for the target words in Figure 5. Results appear to indicate an acceleration of the trend after 2015, though statistical significance was borderline, t(19)=-2.59, p-value ≈ 0.02.

Correlations of prejudice-denoting word usage across news media
Correlations of yearly frequency counts for specific prejudice themes across the 47 news media outlets in the 2000-2019 time range suggest that left-leaning and centrist news media outlets tend to be synchronized in the yearly usage of words that denote racism. In contrast, moderate left-leaning, centrist, and right-leaning outlets tend to be highly correlated in the usage of terms that denote anti-Semitism. Centrist and right-leaning outlets also seem to be correlated in their usage of terms that denote homophobia, see Figure 9.

Correlation between written news media and TV cable news
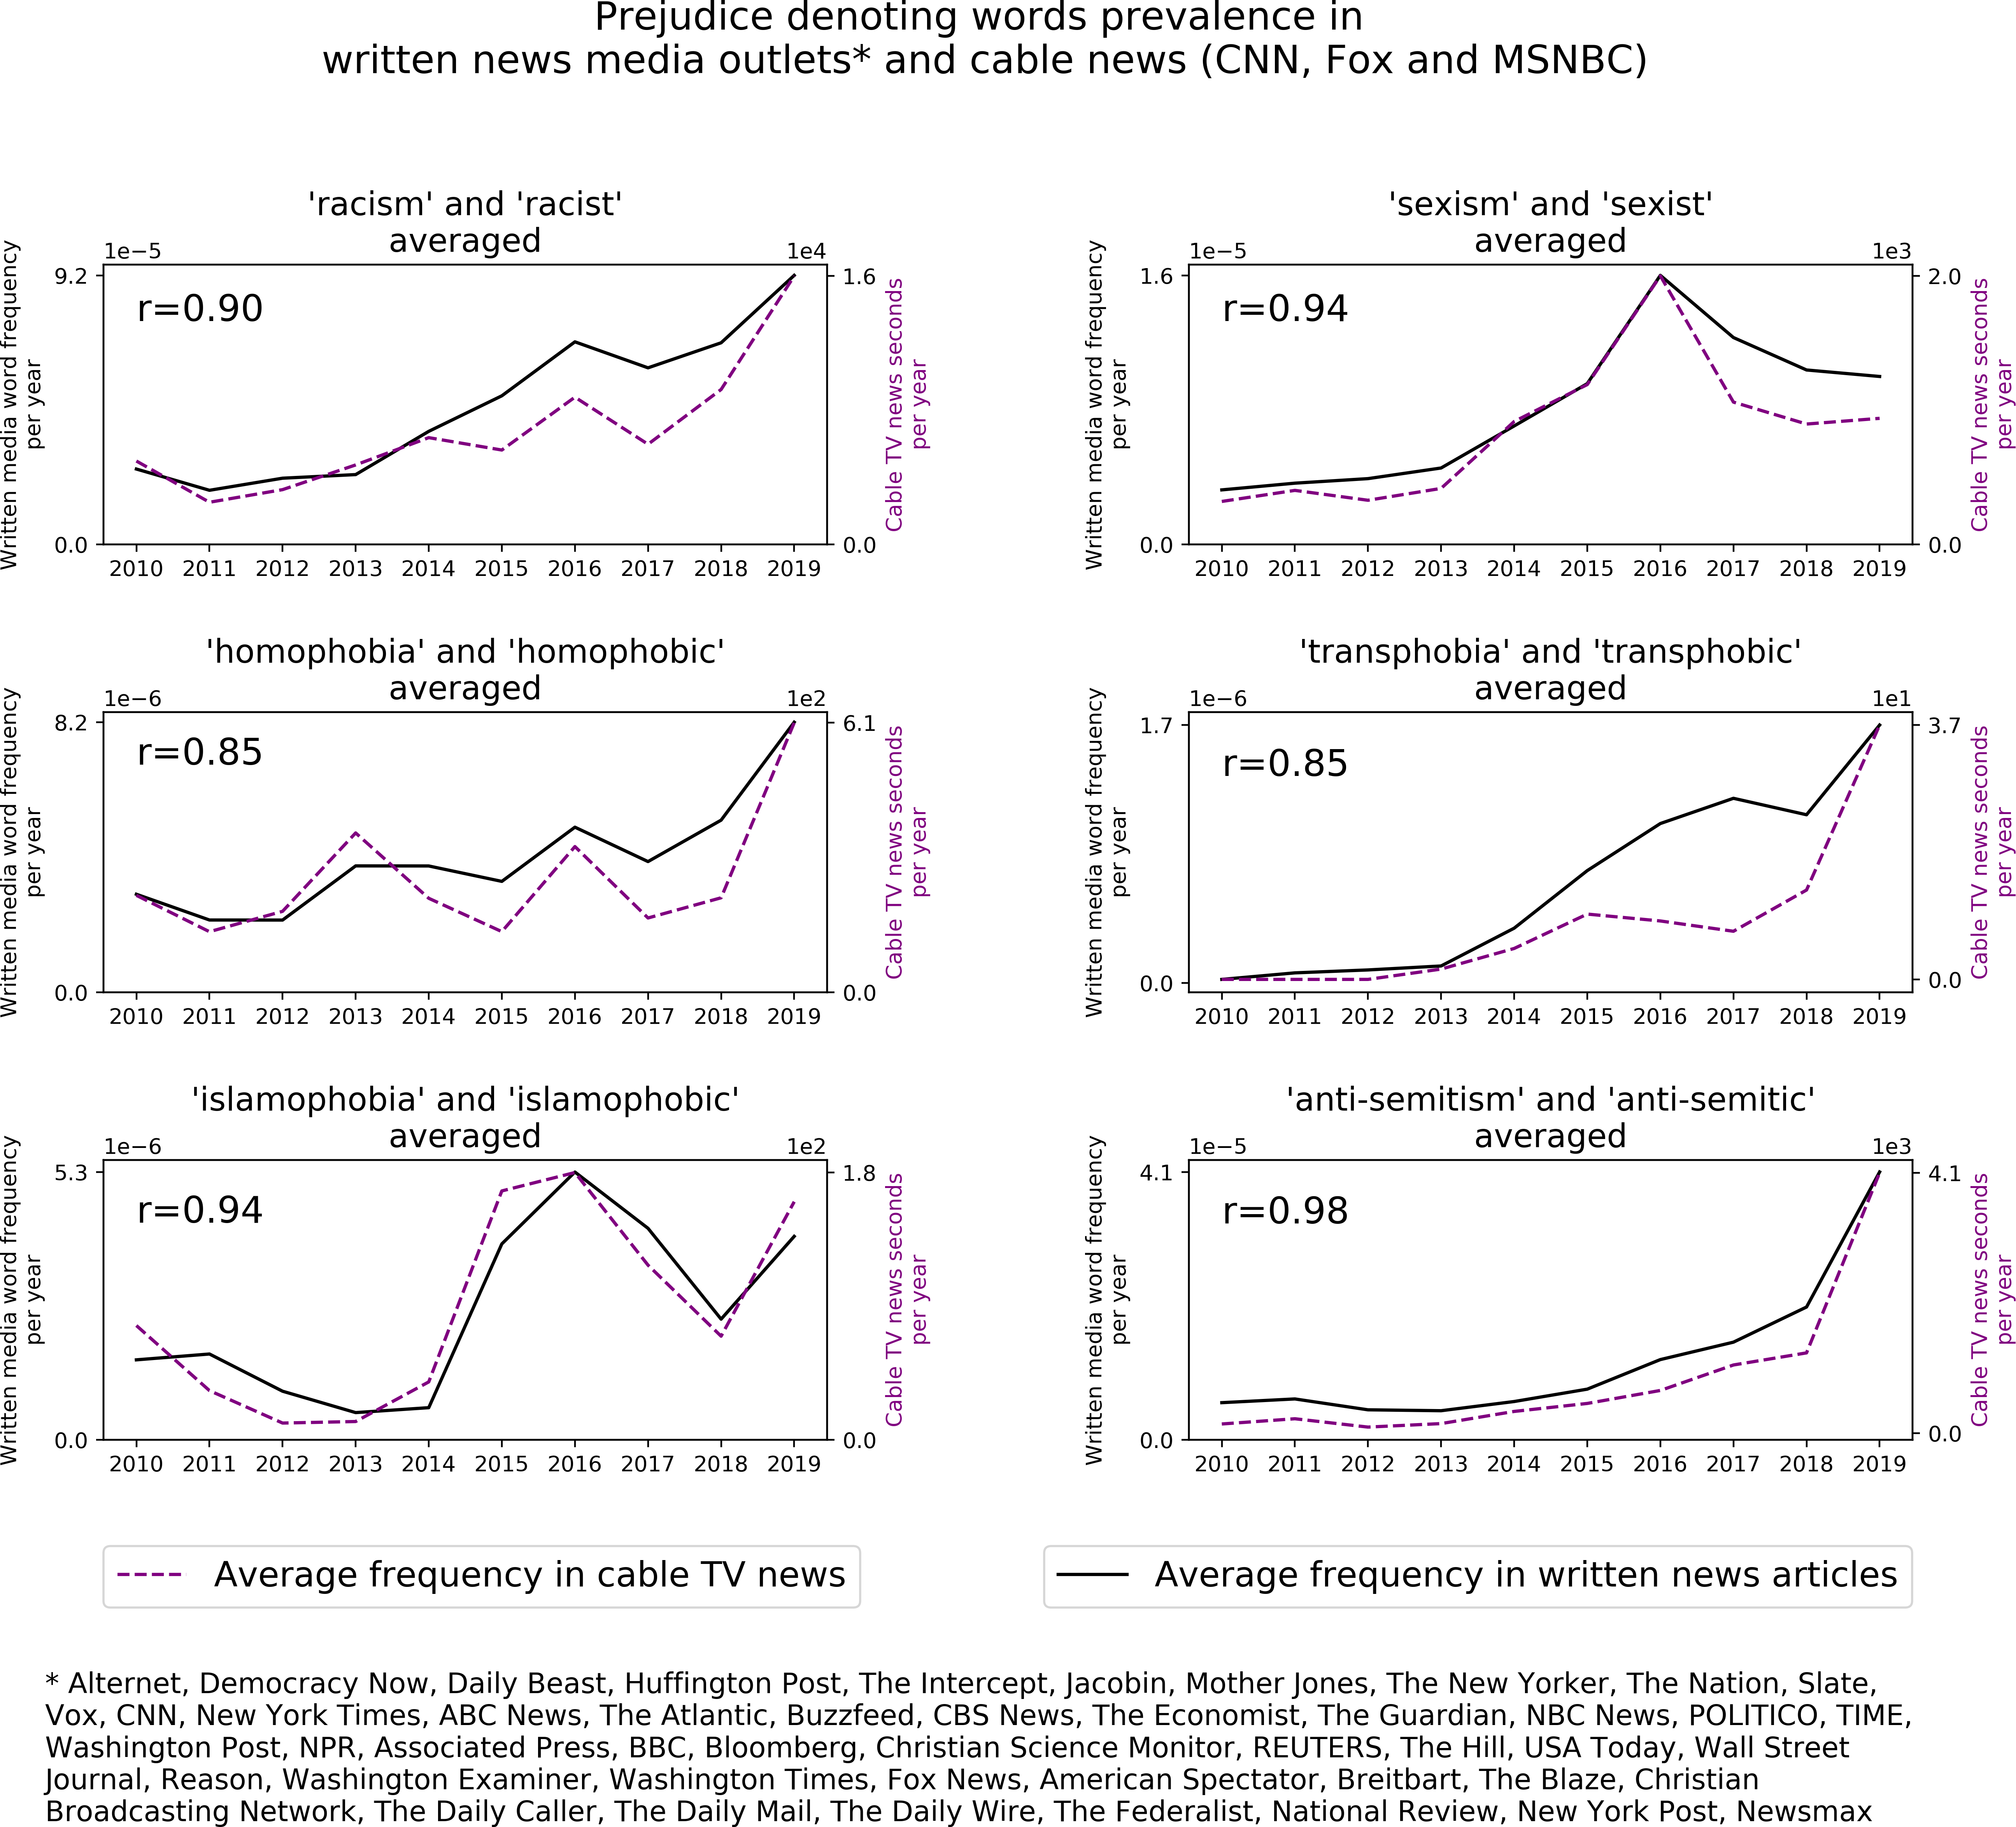
Using word prevalence data from Stanford Cable TV News Analyzer [2], [3] (containing data since 2010), we compare the prevalence of prejudice related words between written news media and TV cable news (CNN, Fox and MSNBC) for the 2010-2019 time frame, see Figure 10. The degree of correlation between prejudice-denoting words in written news media and TV cable news is very high as indicated by the large r Pearson correlation coefficients in the upper left corner of each plot.
News outlets pioneers and followers in the usage of prejudice words
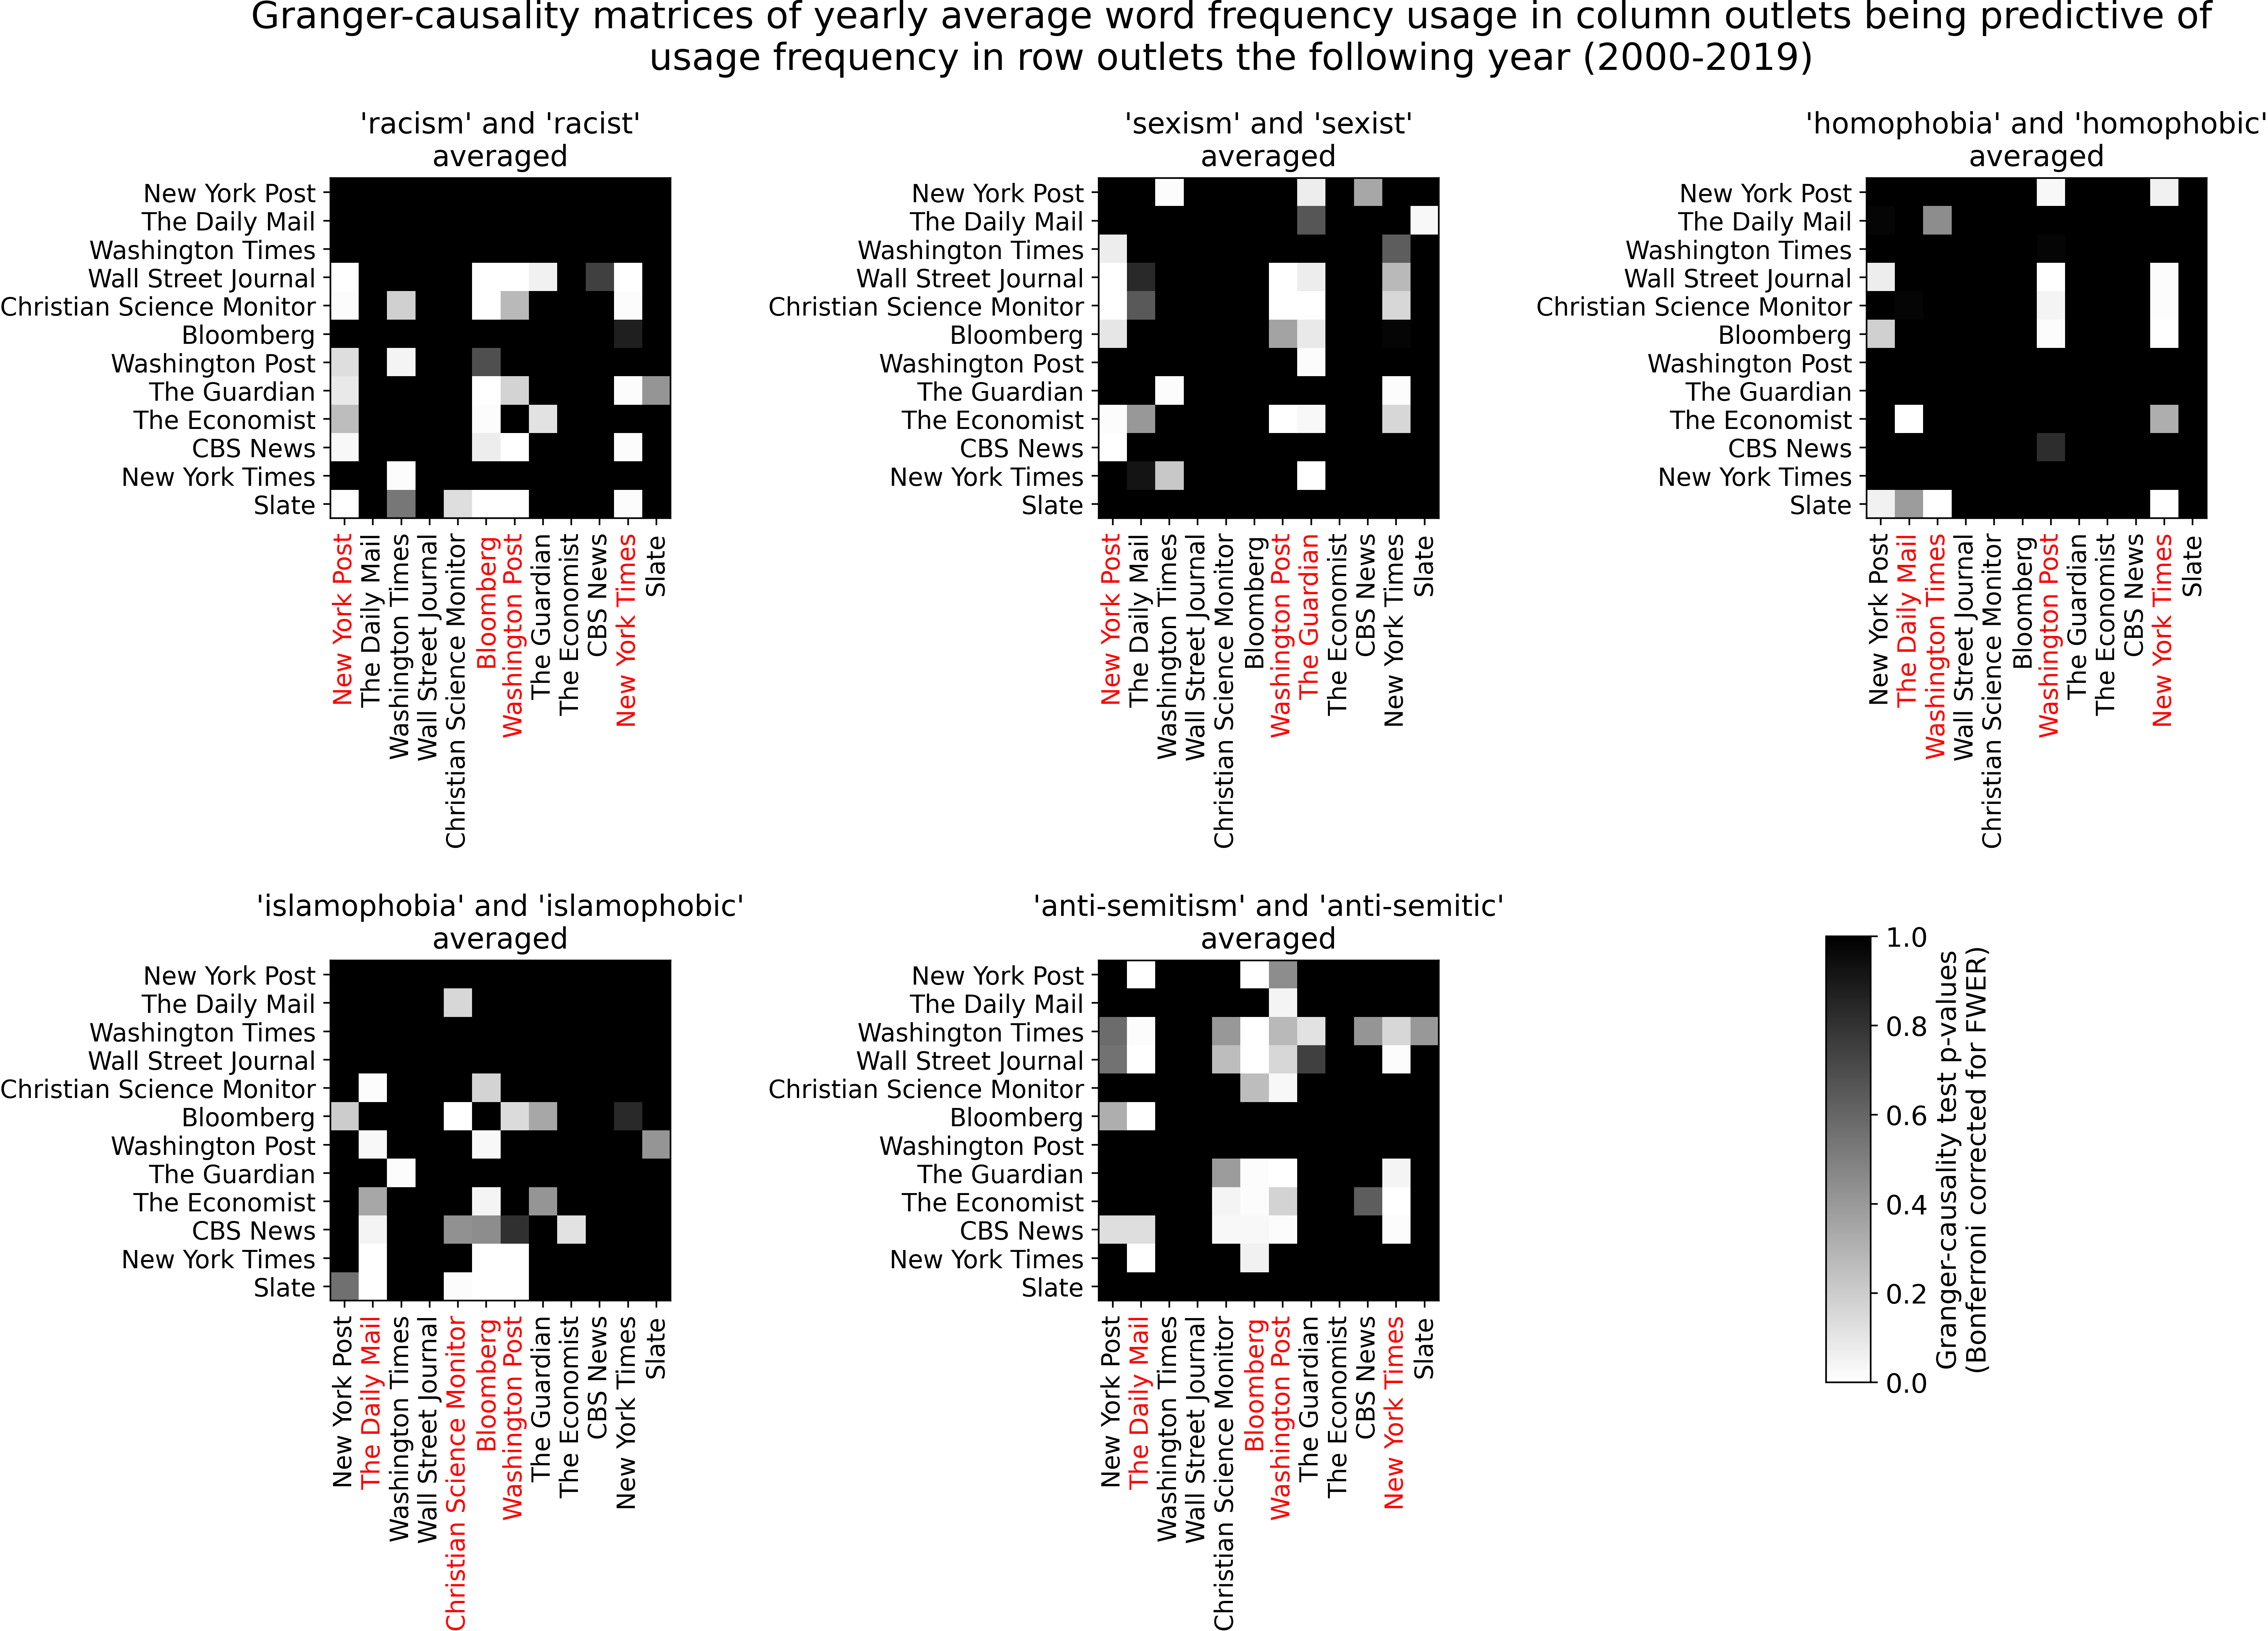
Granger-causality tests can be used to determine whether a time series of prejudice- denoting words yearly frequency in one outlet is predictive of future frequency counts of those words in another outlet [4]. The term causality in Granger causality is misleading because one time series preceding another is a necessary but not sufficient condition for establishing causation. Thus, we used the Granger-causality test to simply describe statistically significant precedence in time. We use the ssr-based test for determining effect size.
Figure 11 shows a matrix of color-coded p-values (Bonferroni corrected for multiple comparisons) representing Granger-causality tests for time series of average frequency of prejudice-denoting words in an outlet (columns) being predictive of future time series (lag=1 year) of the same set of words in another outlet (rows). The columns with the largest amount of p-values below the 0.01 significance threshold are color-coded in red to highlight the outlets that have led the way in the usage of prejudice denoting terms. The matrix shows that some influential outlets such as The New York Times, Bloomberg or The Washington Post have been trend setters in the usage of prejudice related terms while other outlets have followed the trend in the subsequent year.
Prejudice words in news media and public perceptions of prejudice
We next compare indexes derived from survey data on public opinion perceptions about the severity of different types of prejudice in U.S. society and news media frequency usage of prejudice-denoting words. We use publicly available survey data about Americans’ perceptions on the prevalence of different types of prejudice in the country. This is not to be confused with survey data attempting to assess the existence of prejudicial attitudes among survey participants. Rather, we collected surveys assessing participants’ subjective perceptions about the severity of prejudice itself in the wider society.
To create robust indices on perceptions of prejudice severity that encompass the entire time range analyzed (2000-2019), we “stitched” together different longitudinal surveys, each measuring a common latent variable of specific prejudice severity perceptions, using the Dyad Ratios algorithm [5], a method for the extraction of a common dimension in longitudinal data such as survey marginal responses over time that are massively incomplete. That is, most variables (survey questions) do not exist for most time samples. The Dyad Ratios algorithm combines several longitudinal surveys into a single index that provides a more robust overall measurement of sentiment across the population than each longitudinal survey in isolation
The correlation between prevalence of prejudice denoting words in news media and public perceptions of prejudice severity is very high, see Figure 12. A notable exception is the relationship between homophobia-denoting words prevalence in news media and public perceptions on severity of homophobia, where the correlation is negative.
We also tested whether prejudice words frequency usage in news media predicts shifts in public opinion or the other way around. We used the KPSS test to assess stationarity and apply differencing if needed to stationarize the time series. Granger-causality tests, Bonferroni adjusted for multiple comparisons, for test lags of 1, 2 and 3 years, show that word usage of ethnic and gender prejudice-denoting terms in news media is predictive of shifts in public opinion about the severity of ethnic and gender prejudice, see Figure 12. All Granger causality tests in the reverse direction (public opinion → word frequency) for all types of prejudice were not significant.

Limitations of this work
Our methodology has some limitations that we discuss in detail in the paper. Briefly stated, frequency counts of prejudice denoting terms in news media lack critical information about the context in which the terms are being used. Another limitation of our analysis is the sparsity of public opinion time series data regarding perceptions on severity of some types of prejudice such as anti-Semitism and Islamophobia. Also, the time series survey data used is statistically underpowered (i.e. it is very short) due to the decaying availability of survey data for earlier years. The short nature of the time series analyzed creates substantial ambiguity about how to test and remove nonstationarity prior to applying Granger-causality.
Conclusion
Our results document a marked increase in the prevalence of prejudice-denoting words in news media discourse within the 2010-2019 time frame. The trend precedes the emergence of Donald Trump in the political landscape for most of the terms analyzed but appears to accelerate after 2015. The abrupt and dramatic changes in word frequencies suggest the existence of powerful underlying social dynamics at play.
It is noteworthy that prejudice-denoting words are markedly increasing in prevalence alongside long-term decreases in overt expression of prejudice [6]-[9] yet recent increases in the perceived prevalence of such prejudice among the general public. It is our hope that the detailed characterization of the phenomena presented here can pave the way for future studies looking in-depth at potential causal factors for the trends described herein as well as the impact of news media rhetoric on public consciousness and the social implications of growing perceptions of prejudice severity among the general population.
References
[1] “AllSides Media Bias Ratings,” AllSides, 2019. https://www.allsides.com/blog/updated-allsides-media-bias-chart-version-11 (accessed May 10, 2020).
[2] J. Hong et al., “Analyzing Who and What Appears in a Decade of US Cable TV News,” ArXiv200806007 Cs, Aug. 2020, Accessed: Sep. 02, 2020. [Online]. Available: http://arxiv.org/abs/2008.06007
[3] Computer Graphics Lab at Stanford University, “Stanford Cable TV News Analyzer,” Stanford Cable TV News Analyzer. https://tvnews.stanford.edu/ (accessed Sep. 02, 2020).
[4] C. W. J. Granger, “Investigating Causal Relations by Econometric Models and Cross-spectral Methods,” Econometrica, vol. 37, no. 3, pp. 424–438, 1969, doi: 10.2307/1912791.
[5] J. A. Stimson, “The Dyad Ratios Algorithm for Estimating Latent Public Opinion: Estimation, Testing, and Comparison to Other Approaches,” Bull. Sociol. Methodol. Méthodologie Sociol., vol. 137–138, no. 1, pp. 201–218, Jan. 2018, doi: 10.1177/0759106318761614.
[6] Krysan, M., & Moberg, S., “Trends in racial attitudes,” University of Illinois Institute of Government and Public Affairs., Aug. 25, 2016. https://igpa.uillinois.edu/programs/racial-attitudes#section-5 (accessed Jul. 13, 2019).
[7] S. P. Moberg, M. Krysan, and D. Christianson, “Racial Attitudes in America,” Public Opin. Q., vol. 83, no. 2, pp. 450–471, Sep. 2019, doi: 10.1093/poq/nfz014.
[8] P. V. Marsden, T. W. Smith, and M. Hout, “Tracking US Social Change Over a Half-Century: The General Social Survey at Fifty,” Annu. Rev. Sociol., vol. 46, no. 1, pp. 109–134, Jul. 2020, doi: 10.1146/annurev-soc-121919-054838.
[9] K. D. Meagher and X. Shu, “Trends in U.S. Gender Attitudes, 1977 to 2018: Gender and Educational Disparities,” Socius, vol. 5, p. 2378023119851692, Jan. 2019, doi: 10.1177/2378023119851692.
Amazing to see so clearly how a small group of media controllers can drive a population into moral-panic madness by pumping out their propaganda. It is so easy to drive the leftist hysteria, as they have done, to distract away from the real issues.
So a new political tool was introduced around 2015 — name calling. Instead of debating ideas, I just say “You are a racist”